Lab / Open methodology
Java 8 → 25: one order report, two runtimes
The same bytecode reports over 1 million in-memory orders in 1.891 ms → 1.886 ms. A synthetic runtime study across seven data sizes and 440 real JVM runs.
Corretto 8u432toCorretto 25.0.3
Same task, two systems
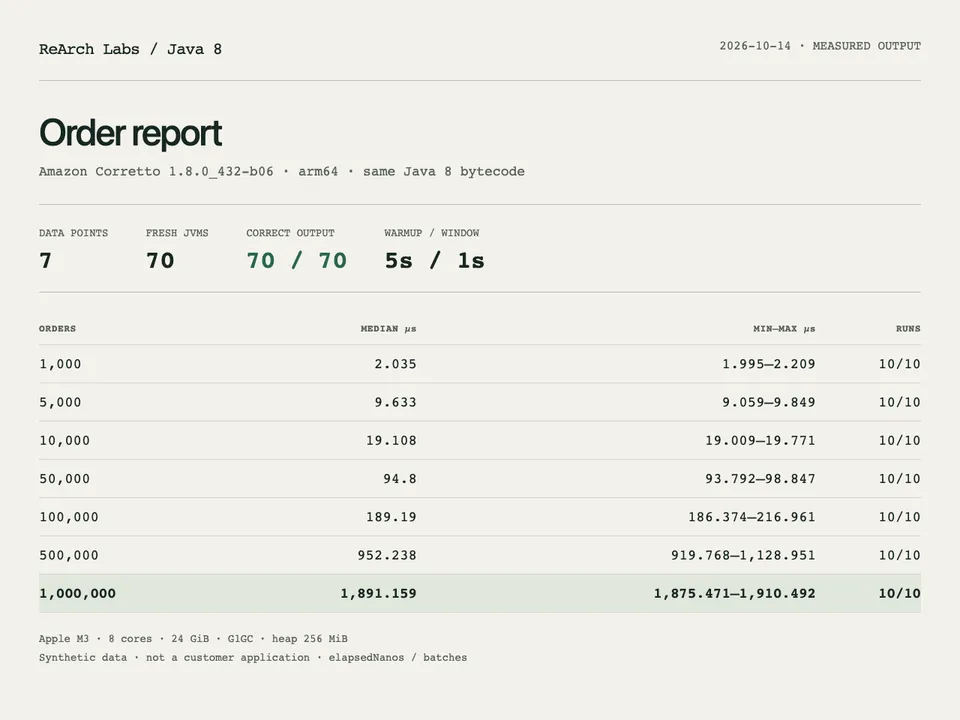
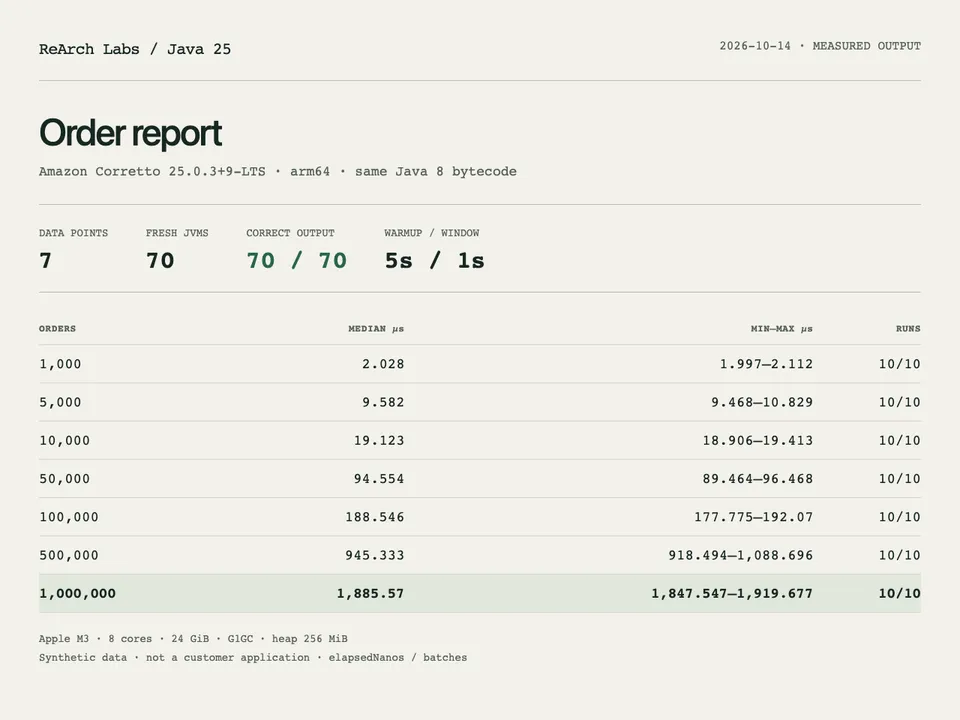
Drag the divider, or use the left/right arrow, Home and End keys.
Results
- Before
- After
In-memory report over 1 million orders
↓ 0.3%Lower is better · Median of 10 runs
Measurement method →Try it yourself
Replay the recorded lab results side by side.
As the workload grows
Report duration by order count
- Before
- After
Report duration by order count (µs)
Show as a table
| Synthetic order records | Before | After |
|---|---|---|
| 1,000 | 2.04 µs | 2.03 µs |
| 5,000 | 9.63 µs | 9.58 µs |
| 10,000 | 19.11 µs | 19.12 µs |
| 50,000 | 94.8 µs | 94.55 µs |
| 100,000 | 189.19 µs | 188.55 µs |
| 500,000 | 952.24 µs | 945.33 µs |
| 1,000,000 | 1,891.16 µs | 1,885.57 µs |
How we measured
Environment, protocol and technical analysis
Environment and data
- Environment
- Apple M3 · 8 cores · 24 GiB RAM · macOS Darwin 25.5.0 · native arm64. Shared developer workstation with a browser and the website development server running.
- Dataset
- 1,000–1,000,000 deterministic orders; no customer data. Integer amounts, cancellation filter and 84 region/month buckets; equal outputs checked by checksum.
- Tools
- Amazon Corretto 1.8.0_432-b06 · Amazon Corretto 25.0.3+9-LTS · Java 8 javac → same bytecode · Python standard library oracle · -Xms256m -Xmx256m -XX:+UseG1GC
- Repetitions
- 44 arms × 10 fresh JVMs = 440 runs. Each JVM: 5 s warmup, at least 1 s measurement; fixed randomized order; every repetition included.
Order-report duration using the same bytecode
1,000–1,000,000 records, two runtimes and ten fresh JVMs per point. An independent Python oracle checks equal output; median per-report duration is reported.
The same bytecode is compiled once by Java 8 javac; Corretto 1.8.0_432-b06 and 25.0.3+9-LTS on native arm64 Apple M3 with 24 GiB RAM. Each JVM uses -Xms256m -Xmx256m -XX:+UseG1GC, 5 s warmup and at least 1 s measurement. Data generation is outside the window; scanning, grouping, checksums and harness-loop overhead are inside. elapsedNanos/batches is the per-run report duration; the median of ten runs is shown. All seven sizes and repetitions are retained. Shared desktop, short windows and different patch levels are limitations; this is not JMH or a production capacity test.
Inspect the measurement script ↗What does the report do?
It filters cancelled orders and groups integer amounts by region and month. Data is generated once; the timed section scans, aggregates and checks the result. Database access, networking and screen rendering are outside this report duration.
The source was compiled once with Java 8. The same bytecode, data and heap/GC flags ran on both installed runtimes. The application was written for this synthetic study; it is not presented as a historical customer migration. The images above are screenshots of a report viewer generated from the actual measurements.
What changed at one million records?
At the preselected primary point, median duration moved from 1.891 ms to 1.886 ms: 0.3% shorter in these conditions. Each value is the median of per-JVM average report durations across ten fresh JVMs. Run ranges were 1.875–1.91 ms for Java 8 and 1.848–1.92 ms for Java 25. All seven data points are retained in the chart and raw file; slow repetitions were not removed.
Read this small median difference alongside the overlapping run ranges. Changing only the runtime did not show a material speed gain for this task; a 0.3% difference is not a migration case on its own. No statistical-significance claim or confidence interval is made.
For your product, the next step is to compare your own daily report or waiting operation with the same output checks. That makes the actual task, rather than a version number, the basis for a migration decision.
Waiting for I/O and computing are different workloads
Two controls accompany the report: jobs waiting for a reply over a real loopback TCP connection, and jobs running a 20,000-step numerical calculation. Each batch submits 16, 64 or 256 jobs together. These counts do not represent simultaneous human users.
Java 25 platform and virtual threads were measured with budgets of both 16 and 128 permits. This separates a larger work budget from executor choice. The dependency has 32 workers and a configured 20 ms wait per request; more client jobs do not remove that dependency limit.
The tables show median batch duration across ten JVMs, not per-job latency. Per-job p95 including queue time is retained separately in the raw data and distribution file.
TCP waiting control
| Runtime / executor / permits | 16 jobs · ms | 64 jobs · ms | 256 jobs · ms |
|---|---|---|---|
| Java 8 / platform / 16 | 31.602 | 119.495 | 454.72 |
| Java 25 / platform / 16 | 31.098 | 114.674 | 438.213 |
| Java 25 / virtual / 16 | 30.892 | 115.55 | 430.669 |
| Java 25 / platform / 128 | 31.256 | 60.785 | 220.083 |
| Java 25 / virtual / 128 | 31.106 | 60.939 | 221.106 |
CPU control
| Runtime / executor / permits | 16 jobs · ms | 64 jobs · ms | 256 jobs · ms |
|---|---|---|---|
| Java 8 / platform / 16 | 0.251 | 0.69 | 2.5 |
| Java 25 / platform / 16 | 0.254 | 0.731 | 2.619 |
| Java 25 / virtual / 16 | 0.232 | 0.652 | 2.497 |
| Java 25 / platform / 128 | 0.258 | 0.696 | 2.587 |
| Java 25 / virtual / 128 | 0.235 | 0.684 | 2.477 |
Limits of this environment
Measurement used one shared Apple M3 workstation. A browser and the development server remained open; other agents were asked to avoid heavy builds and tests. One-minute system load ranged from 2.56 to 21.14; before/after values for every run are in the raw data. There was no CPU quota or separate load generator; background OS and browser activity was not separately isolated. A fixed five-second warmup does not establish full JIT steady state.
The exact builds were Corretto 8u432-b06 and 25.0.3+9-LTS. The Java 8 build is not described as current; major-version and patch differences were not isolated. Findings belong to these builds and tasks. Price, licensing, RSS/peak memory, GC pauses and vulnerabilities were not measured, so no cost or security percentage is derived.
The initial full attempt stopped at process three when ephemeral TCP ports were exhausted. All records were retained. The controlled dependency delay changed from 2 ms to 20 ms and each JVM received a fresh dependency port; the entire 440-run matrix then restarted. The two completed measurements from that attempt are excluded from this dataset.
The full run took 48.7 minutes of wall-clock time. That is not human work time. Human hours were not tracked, so the process section makes no numerical effort claim.
Sources and reproduction
440 raw measurements — CSV, all distributions, environment and run manifest, publication review and source + all logs — ZIP are public. The raw publishable: false flags mean the runner does not automatically approve publication. The flags remain unchanged; a separate publication review documents this study’s scope.
Reproduce the same matrix with the commands in the source repository. Oracle’s virtual thread documentation explains the distinction between waiting I/O and CPU work. Amazon Corretto 8 and Corretto 25 document the distribution’s support model, not the currency of this installed old build. The harness does not use JMH.
What we did
Experiment scope
AIDesigned synthetic report, I/O and CPU controls that produce the same output.
HumanThe site owner requested common Java migration examples and publication of actual measurements.
Execution and verification
AIImplemented the harness, ran actual JVM processes, checked independent output checksums and file integrity, and retained the failed initial attempt separately.
HumanLocal full measurement was authorised. No separate human time log or human code-review record was kept for this step.
Open evidence package
AIPrepared all measurements, sources, control arms and bilingual findings without changing raw values.
HumanThe site owner requested launch. Automation wall time was not reported as human working hours.
Time was not tracked.