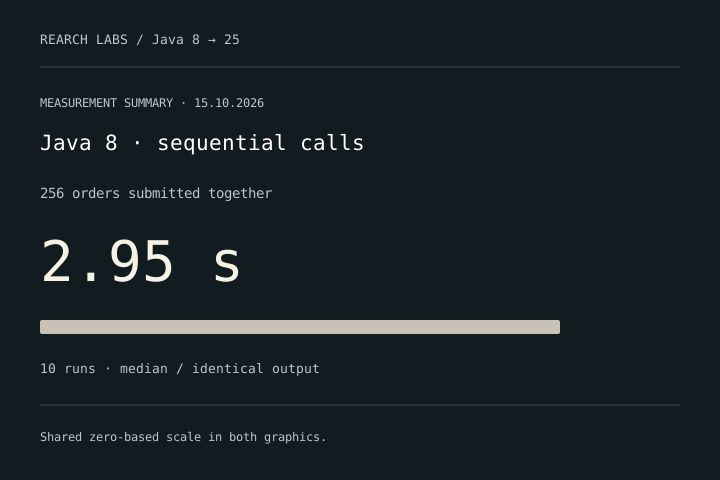
012.95 s
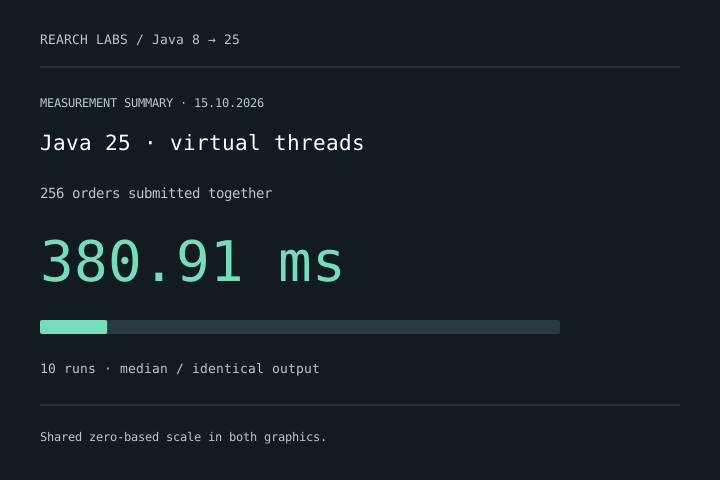
Java 8 · sequential calls
8 workers; wait for three independent services sequentially per order.
- CPU time
- 259.207 ms
- Peak platform threads
- 12
CODE, ARCHITECTURE AND RUNTIME CHANGES
Queued orders, heavy reports, slow queries. Increase the workload and compare how the original implementation and improved code complete the same task.
Read our measurement principlesJava 8 → 25 LAB MEASUREMENT
Prepare an order using price, stock and shipping responses. We measured runtime migration and concurrent workflow changes separately against identical order results.
Clear a peak-time order queue sooner. Run independent tasks together rather than occupying a worker while each service responds.
8 workers; wait for three independent services sequentially per order.
Same bytecode and same 8 workers. Only the runtime changed.
Parallel calls; 64 platform workers and a 64-call dependency limit.
Parallel independent calls; same 64-call limit, one virtual thread per task.
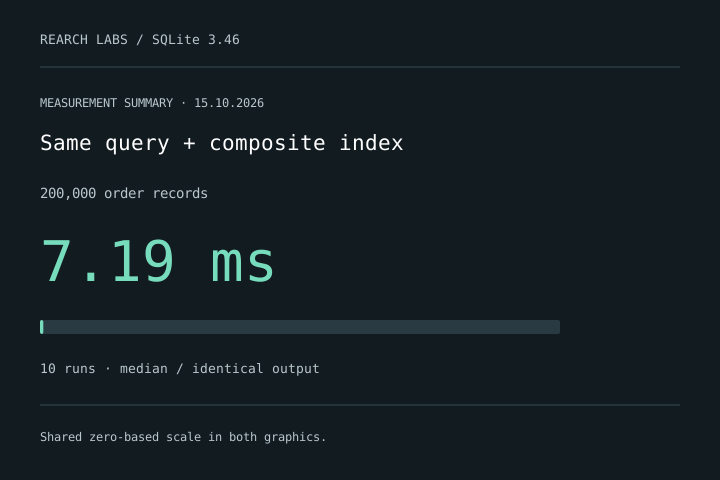
Bars start at zero and share the same time scale across implementations.
Split independent service calls and start them together. Java 25 virtual threads carry waiting tasks on fewer platform threads. The matched platform-pool control shows similar speed with a different thread footprint.
| Implementation | Median duration | CPU time | Peak platform threads |
|---|---|---|---|
| Java 8 · sequential calls | 182.873 ms | 25.94 ms | 12 |
| Java 25 · unchanged old code | 184.777 ms | 18.021 ms | 14 |
| Java 25 · parallel platform control | 31.538 ms | 11.909 ms | 70 |
| Java 25 · virtual threads | 31.61 ms | 10.142 ms | 18 |
| Implementation | Median duration | CPU time | Peak platform threads |
|---|---|---|---|
| Java 8 · sequential calls | 729.54 ms | 52.624 ms | 12 |
| Java 25 · unchanged old code | 725.443 ms | 65.806 ms | 14 |
| Java 25 · parallel platform control | 97.516 ms | 29.633 ms | 70 |
| Java 25 · virtual threads | 97.451 ms | 42.585 ms | 18 |
| Implementation | Median duration | CPU time | Peak platform threads |
|---|---|---|---|
| Java 8 · sequential calls | 2.95 s | 259.207 ms | 12 |
| Java 25 · unchanged old code | 2.93 s | 256.989 ms | 14 |
| Java 25 · parallel platform control | 399.298 ms | 108.114 ms | 70 |
| Java 25 · virtual threads | 380.91 ms | 125.21 ms | 18 |
Compare the recorded CPU time at your own monthly volume.
One batch run = 256 Orders submitted together.
CPU time reduced / month0.3722 hours
Processing cost difference / month—Calculated after you enter a unit price.
Lab CPU time × your volume and unit price. This is not a hosting bill forecast; idle capacity, networking, storage, licences and migration are excluded.
7 cases shown
Application modernization
256 orders completed: 2.95 s → 380.91 ms. Synthetic lab; median of 10 runs. Open code and raw data.
Java 8 · sequential calls→Java 25 · virtual threads
256 orders completed
↓ 87.09%
Lower is better · Median of 10 runs
Measurement method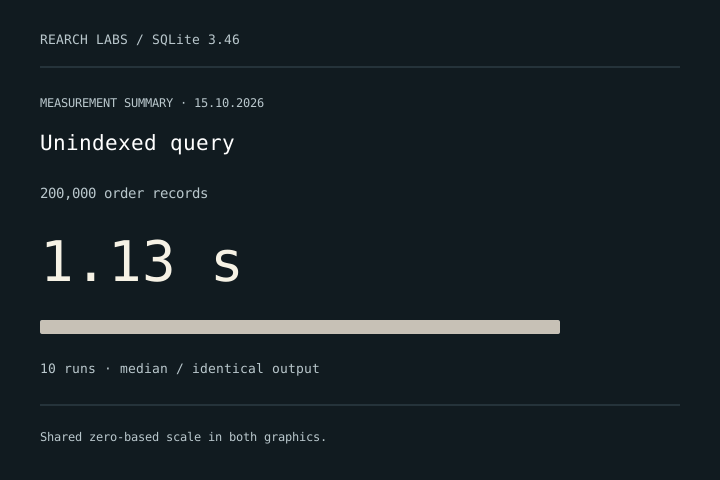
Application modernization
200,000 orders summarized: 1.13 s → 7.19 ms. Synthetic lab; median of 10 runs. Open code and raw data.
Unindexed query→Same query + composite index
200,000 orders summarized
↓ 99.36%
Lower is better · Median of 10 runs
Measurement method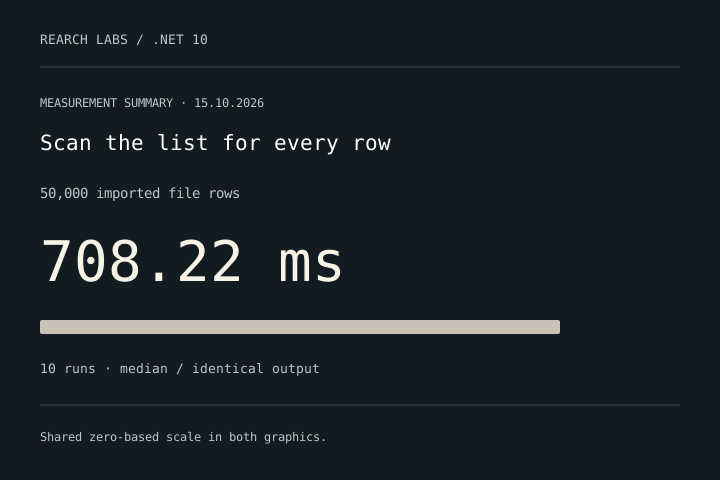
Application modernization
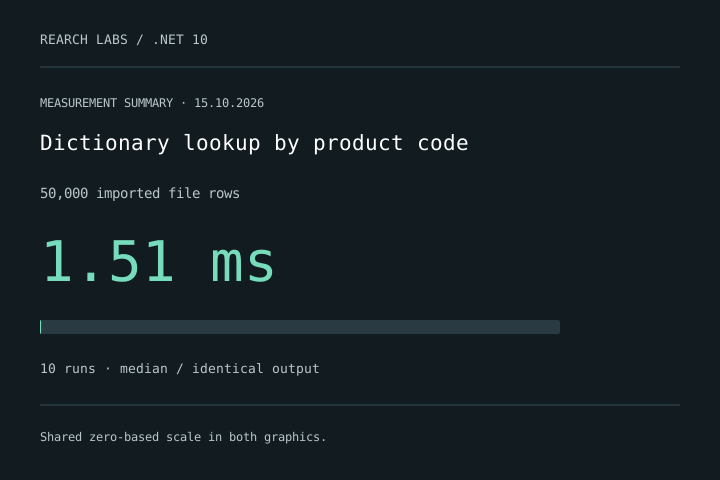
50,000 catalog import rows: 708.22 ms → 1.51 ms. Synthetic lab; median of 10 runs. Open code and raw data.
Scan the list for every row→Dictionary lookup by product code
50,000 catalog import rows
↓ 99.79%
Lower is better · Median of 10 runs
Measurement method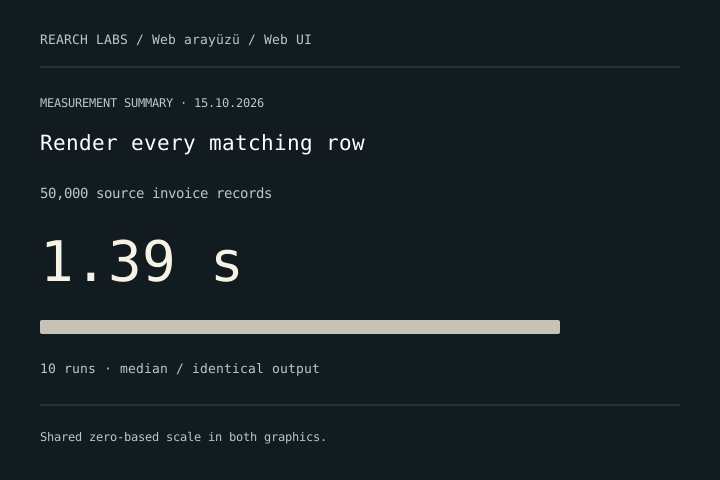
Application modernization
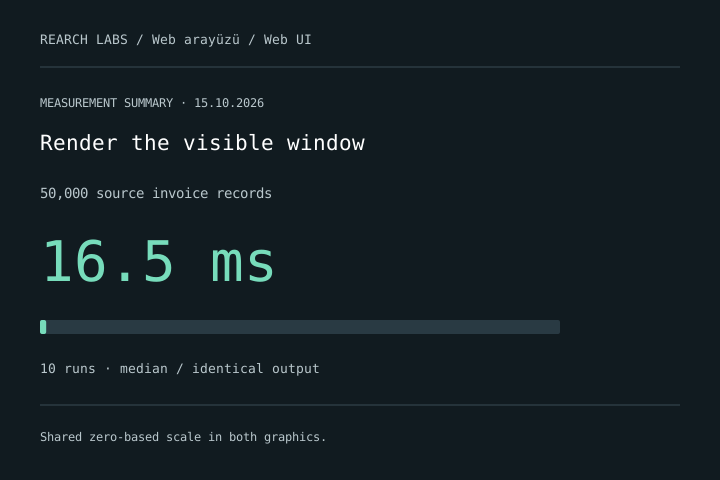
50,000 invoices filtered and listed: 1.39 s → 16.5 ms. Synthetic lab; median of 10 runs. Open code and raw data.
Render every matching row→Render the visible window
50,000 invoices filtered and listed
↓ 98.81%
Lower is better · Median of 10 runs
Measurement method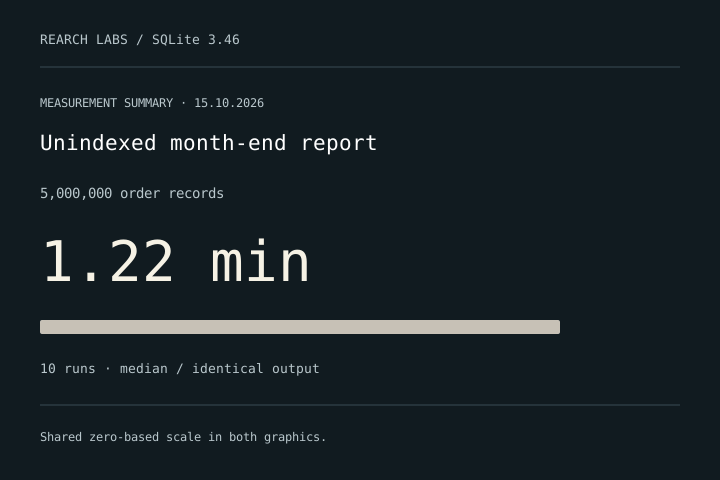
Application modernization
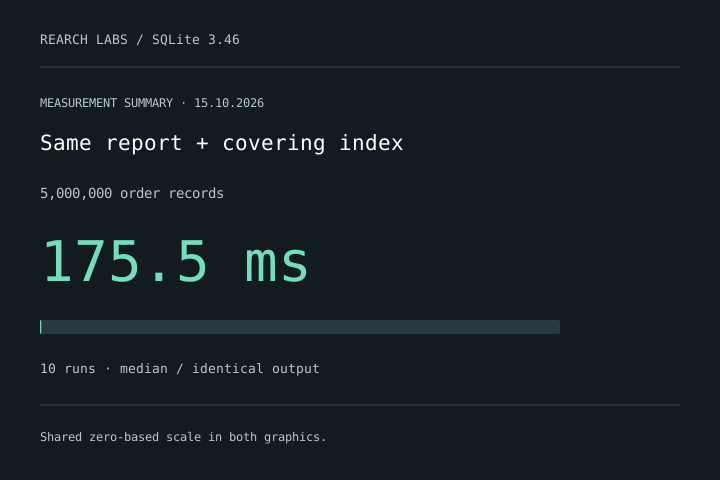
5,000,000 orders summarized: 1.22 min → 175.5 ms. Synthetic lab; median of 10 runs. Open code and raw data.
Unindexed month-end report→Same report + covering index
5,000,000 orders summarized
↓ 99.76%
Lower is better · Median of 10 runs
Measurement method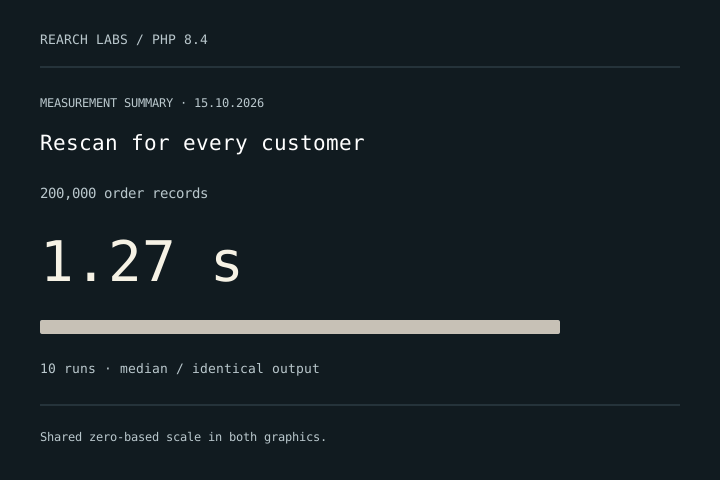
Application modernization
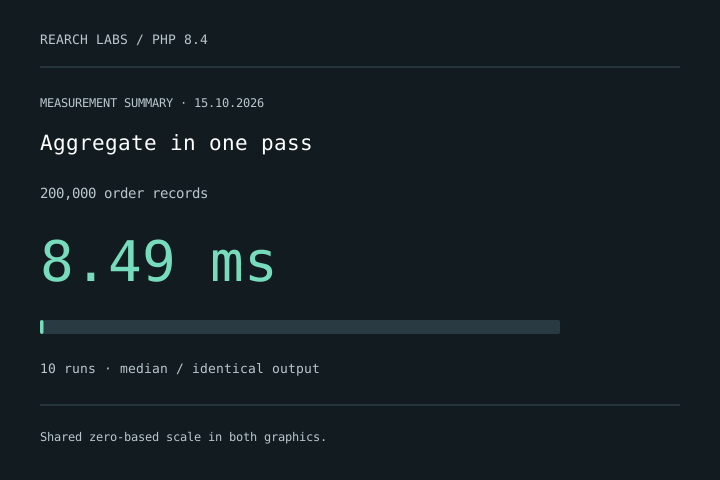
200,000 orders summarized: 1.27 s → 8.49 ms. Synthetic lab; median of 10 runs. Open code and raw data.
Rescan for every customer→Aggregate in one pass
200,000 orders summarized
↓ 99.33%
Lower is better · Median of 10 runs
Measurement method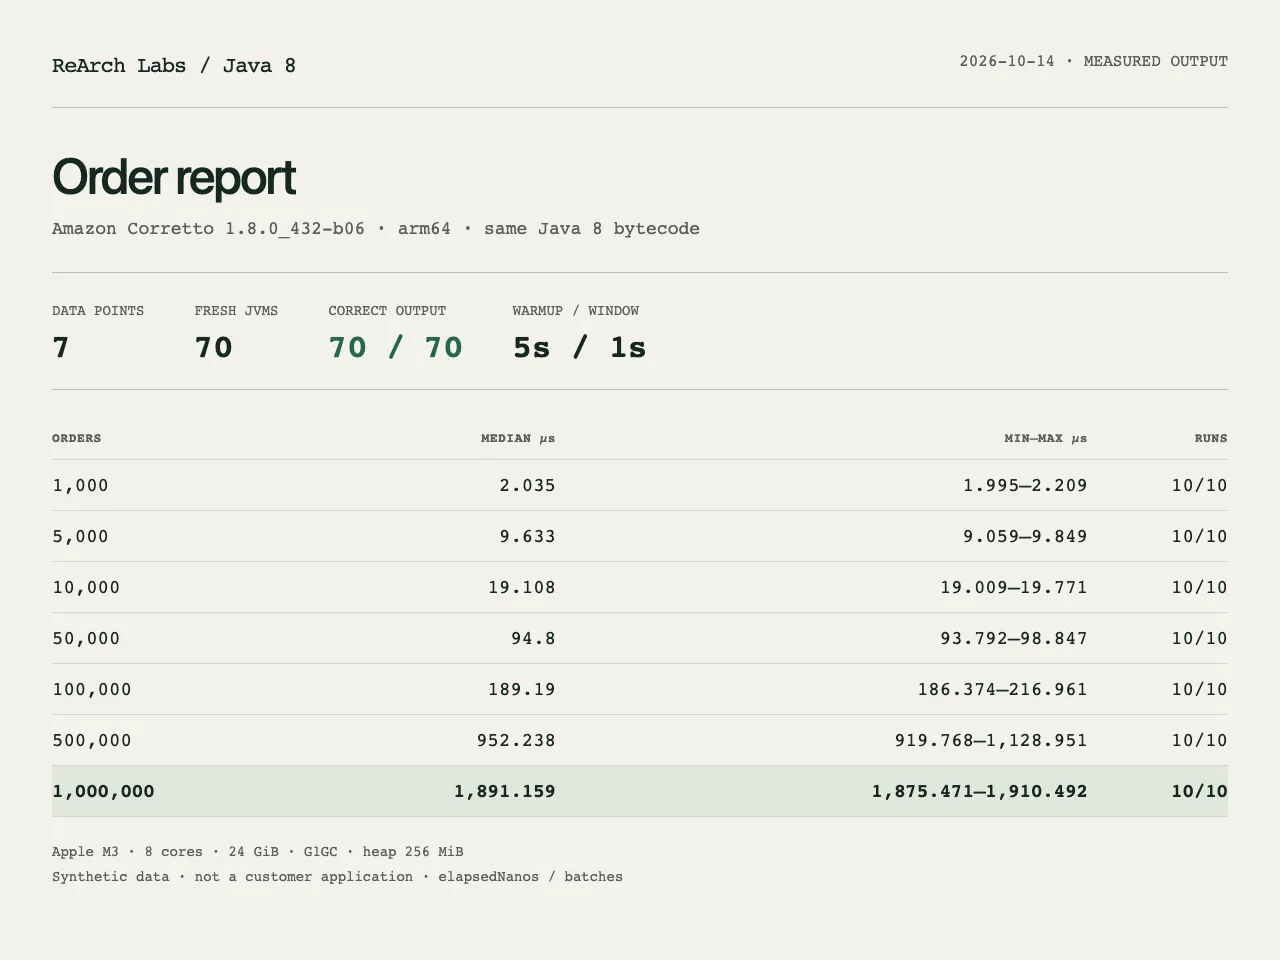
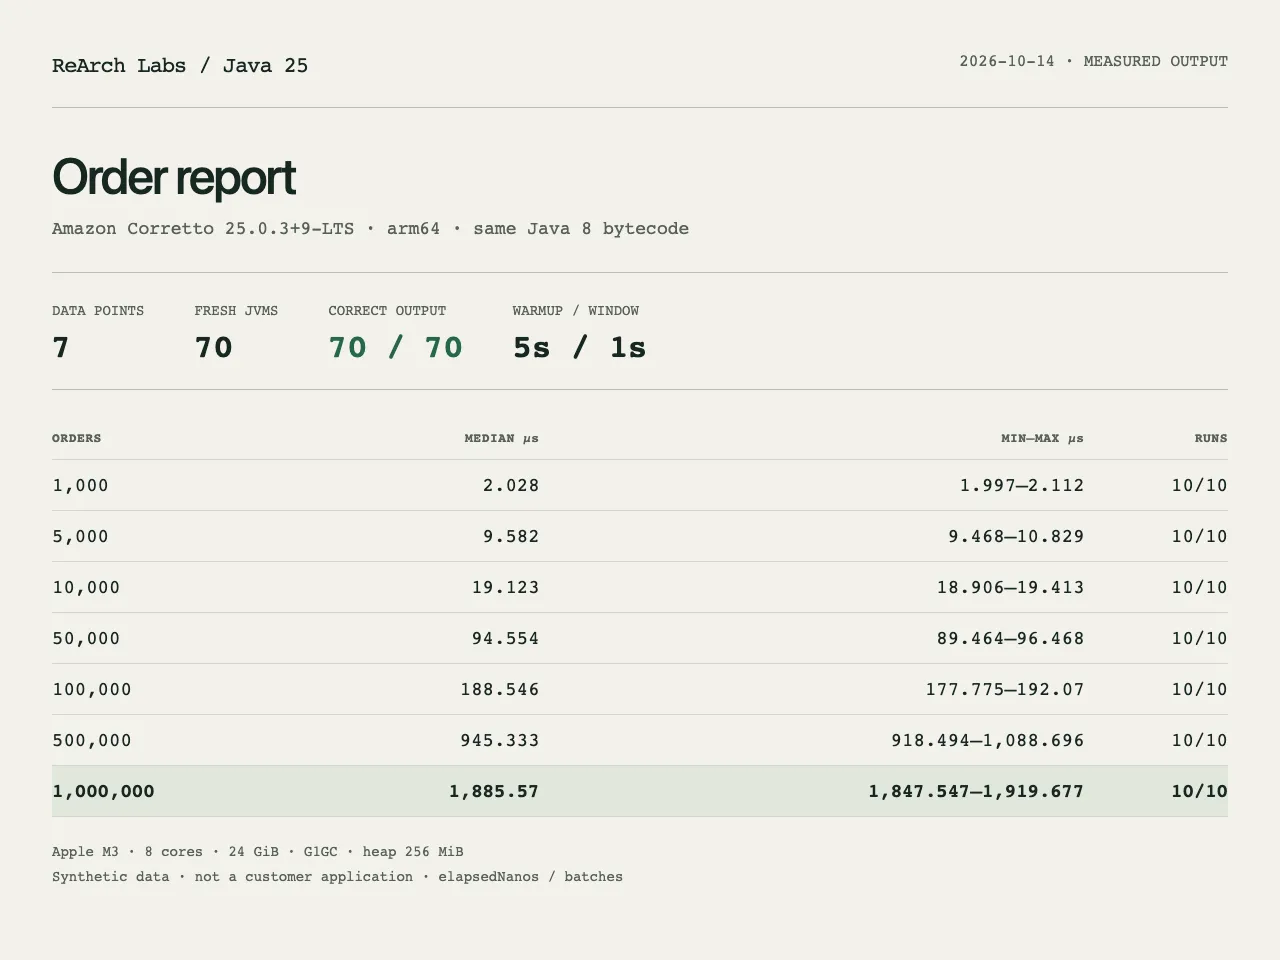
Application modernization
The same bytecode reports over 1 million in-memory orders in 1.891 ms → 1.886 ms. A synthetic runtime study across seven data sizes and 440 real JVM runs.
Corretto 8u432→Corretto 25.0.3
In-memory report over 1 million orders
↓ 0.3%
Lower is better · Median of 10 runs
Measurement method